Back to malware analysis, i recently decided to analyse a completely random sample (as long as it isn’t .NET lol) found on MalwareBazaar, this sample appears to be STOP ransomware.
Preview
I’ve never analysed a ransomware already, and to be honest i thought that this sample was « only » a stealer, but after a quick analysis on Any.run and some initial research, i realised that it was a ransomware dropping a stealer too.
This technique is increasingly used nowadays, threat actors are no longer satisfied by just locking up data and ask for ransom, they actually steal data, and then encrypts it to apply a double pressure on the infected user. So if the user doesn’t want to pay for the ransom, threat actors can still sell or use data stolen to make profit.
Initial analysis
When analysing a sample, i first insure that the malware is packed or not, if it contains resources or interesting strings inside.
For this purpose, i use DiE (Detect it Easy) and PE Studio to gather initial information about the sample.
DiE informs us that the .text section (the section that contains all the executable code) has a very high entropy (7.92) which means the executable is packed or highly obfuscated.
Entropy of .text section
We know that the sample is packed, but, PE Studio shows that it has a decent amount of imports, strings and even an export.. for the moment i cannot understand what is happening here, so let’s fire up IDA to see the code.
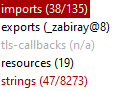
Informations returned by PE Studio
Disassembling
The flow starts with the start function that leads to WinMain.
This type of flow belongs to a Windows application created with Visual Studio (the easy way out). We can assume that this sample was not created by an APT or some big fish, they avoid creating these types of applications because they create bigger executables and leave more tracks of the way that they were created.
Flow graph of WinMain
Except leaving debug traces, Visual Studio applications leave a lot of compiler related functions which can be annoying during analysis, and this sample is no exception to the rule.
Obfuscation
The flow graph of this executable is tricky to understand because it has a lot of branches and a lot of compiler related functions, so i jump to pseudocode view of IDA, and i can see that the malware is heavily obfuscated :
Lot of API calls with 0 parameters or dummy strings
Despite the obfuscation, the flow is rather simple to analyse in pseudocode, because we can easily spot dummy functions.
If found an interesting function responsible of changing the protection of a memory page in order to prepare the field for the decryption of some shellcode. It uses stack strings to load VirtualProtect :
The new protect is PAGE_EXECUTE_READWRITE, a prerequisite to execute code.
Shellcode decryption
I don’t know by which way the shellcode decrypts, but i found the function for. I think it simply copies data to the newly unprotected memory section :
It takes 3 args, a chunk of encrypted data and the address to inject the shellcode.
It then jump to shellcode by a call to the injected memory region :
Call to memory region in pseudocode mode
Newly discovered anti-debugging technique
When i unpacked this sample, i already knew where to jump to go to the shellcode, so i put a breakpoint on the call to shellcode in memory… BUUUT
This guy
When i reversed it, i thought it was only a bug by my fault, when execute the program until the call, i have an ACCESS_VIOLATION error, and impossible to continue.
Without much information, i simply NOPed the bytes out to continue my analysis, but i found this tweet randomly while scrolling on Twitter.
https://twitter.com/fr0gger_/status/1387694972976128003?s=20&t=VeeqmCOPdaCytczCQoMklQ
This technique is apparently used to trap the debugger and beginner reversers, but it is simple to counter, just NOP out the call bytes and reassemble the binary.
I also created a capa rule to detect this technique:
rule:
meta:
name: trap debugger with localsize
namespace: anti-analysis/anti-debugging
author: lordtmk@protonmail.com
scope: basic block
examples:
- B67E5B1985742F62785122B637EF4FBD:0x4B1F5B
features:
- and:
- api: LocalSize
- mnemonic: push
- number: 0
Jump in the shellcode
The first function is responsible for loading LoadLibraryA and GetProcAddress, the 2 APIs used to resolve all other APIs :
Loading APIs by hash
Then, it loads in memory all the APIs needed to pursue its goal.
VirtualAlloc is here the most important API to perform injection
It then calls VirtualAlloc to alloc a memory page to inject the shellcode.
Again, i cannot identify the algorithm used to decrypt the shellcode, but i know this is actually decryption compared to the previous function.
Flow of decryption function
When the decryption is finished, the program simply jumps to address of new shellcode:
Jump to shellcode
Last layer of unpacking
The flow starts again with a lot of stack strings that are translated to APIs using GetProcAddress :
VirtualProtectEx stack string followed by a call to GetProcAddress
Then we have another layer of obfuscation, with dummy function calls, but one of them catches my attention, a call to CreateWindowExA that leads to a stack overflow.
Dummy call that leads to stack overflow
I searched if this call was an anti debugging technique but it seems not. It is easy bypassable if we go back to user code.
Dealing with process hollowing
The last step of this shellcode is to inject next code into a newly created process of the program itself, and for that purpose, it uses process hollowing, which is one of the most used technique nowadays.
1st : Create a process in suspended state
Always check the args of CreateProcessA
Here, GetCommandLineA is used to retrieve the command line used in the program. This function will retrieve the full path of the executable.
Program starts child in suspended mode
In suspended state, the program doesn’t run and just waits for his parent to resume it.
2nd : Delete all content of executable and writes data to it
NtUnmapViewOfSection is a low-level, poorly documented API that is used to wipe all sections from a program. It is mainly used to inject into legitimate programs, because the header stays the same (for example we can inject malicious code inside a legitimate executable of notepad.exe. The headers will stay the same but the data will be our malicious code.) This technique was first seen in Stuxnet and is used to execute legitimate looking programs in Windows.
1st memory write attempt
ZwWriteVirtualMemory is another low level call that is used to write data inside memory pages.
2nd memory write attempt
It then calls the more conventional WriteProcessMemory, which is a highest level call, to achieve the same goal.
3rd : Setting thread context and resume it
This is the most important part of the technique, we can catch the new process start address :
First, a call to GetThreadContext is made to retrieve the CONTEXT structure that contains data about the program execution, you can find more information here : https://www.nirsoft.net/kernel_struct/vista/CONTEXT.html
Then, a call to SetThreadContext is made. it will set the start address of the newly created process. It is important to keep this address because we will use it in a moment.
StartAddress
We can find the address in the hexdump of CONTEXT structure. After this call, we must edit the memory of the program to be launched.
Memory page of suspended process (make sure it is RWX)
The base address of the process is 0x400000, so we must go to 0x24141 to find the entry point :
These are the bytes that will be executed when the program will launch
To prevent program for executing, we will patch these 2 bytes to create an infinite loop. Save carefully these 2 bytes (E8 3D) and replace them with EB FE, which will create an infinite jump to the address.
Patched bytes
Next, we can safely step over the ResumeThread call, and finally attach to the newly resumed process.
The process is now resumed
When we attach to the running process, we will see this ; the program is jumping to the same address over and over. Don’t forget to put a breakpoint on this after continue :
![]()
Endless jump
We next have to patch the bytes back :
![]()
Patched bytes
Instruction has changed
We can safely end the parent process :
The parent programs ends with ExitProcess
There is the great article that i referred to achieve this : https://airbus-cyber-security.com/following-process-hollowing-ollydbg/
End of the 1st part
Basically we are here :
We just covered 1 injection
And there is a looooot more to do : 😅
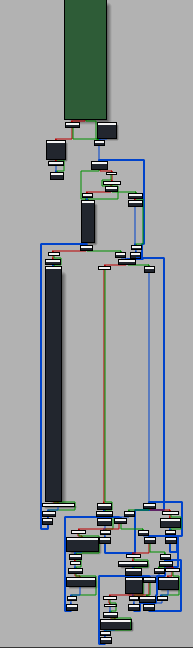
The entire execution flow of the program
This 1st part of the sample was quite easy, just dealing with obfuscation and anti-debugging technique, and then follow process hollowing to unveil the real malicious sample.
You can search this hash on MalwareBazaar if you want to study this malware : b67e5b1985742f62785122b637ef4fbd
Stay tuned for part 2!